Many maps are ‘one–off’ products – e.g. a map of a tourist resort. But an even larger number are what are called Series Maps. All the maps types described elsewhere may be part of a map series.
Topographic Series Maps
These maps typically have a constant scale (eg 1:100,000) and join together in a regular fashion such that a large area is continuously mapped. Also, the selection and depiction of features – often utilising complex sets of rules – is consistent for the whole series. Index maps are used to show the location and extent of each map in the series.
See Topographic Maps for information about topographic series maps.
Series maps are most likely to be produced by government mapping agencies.
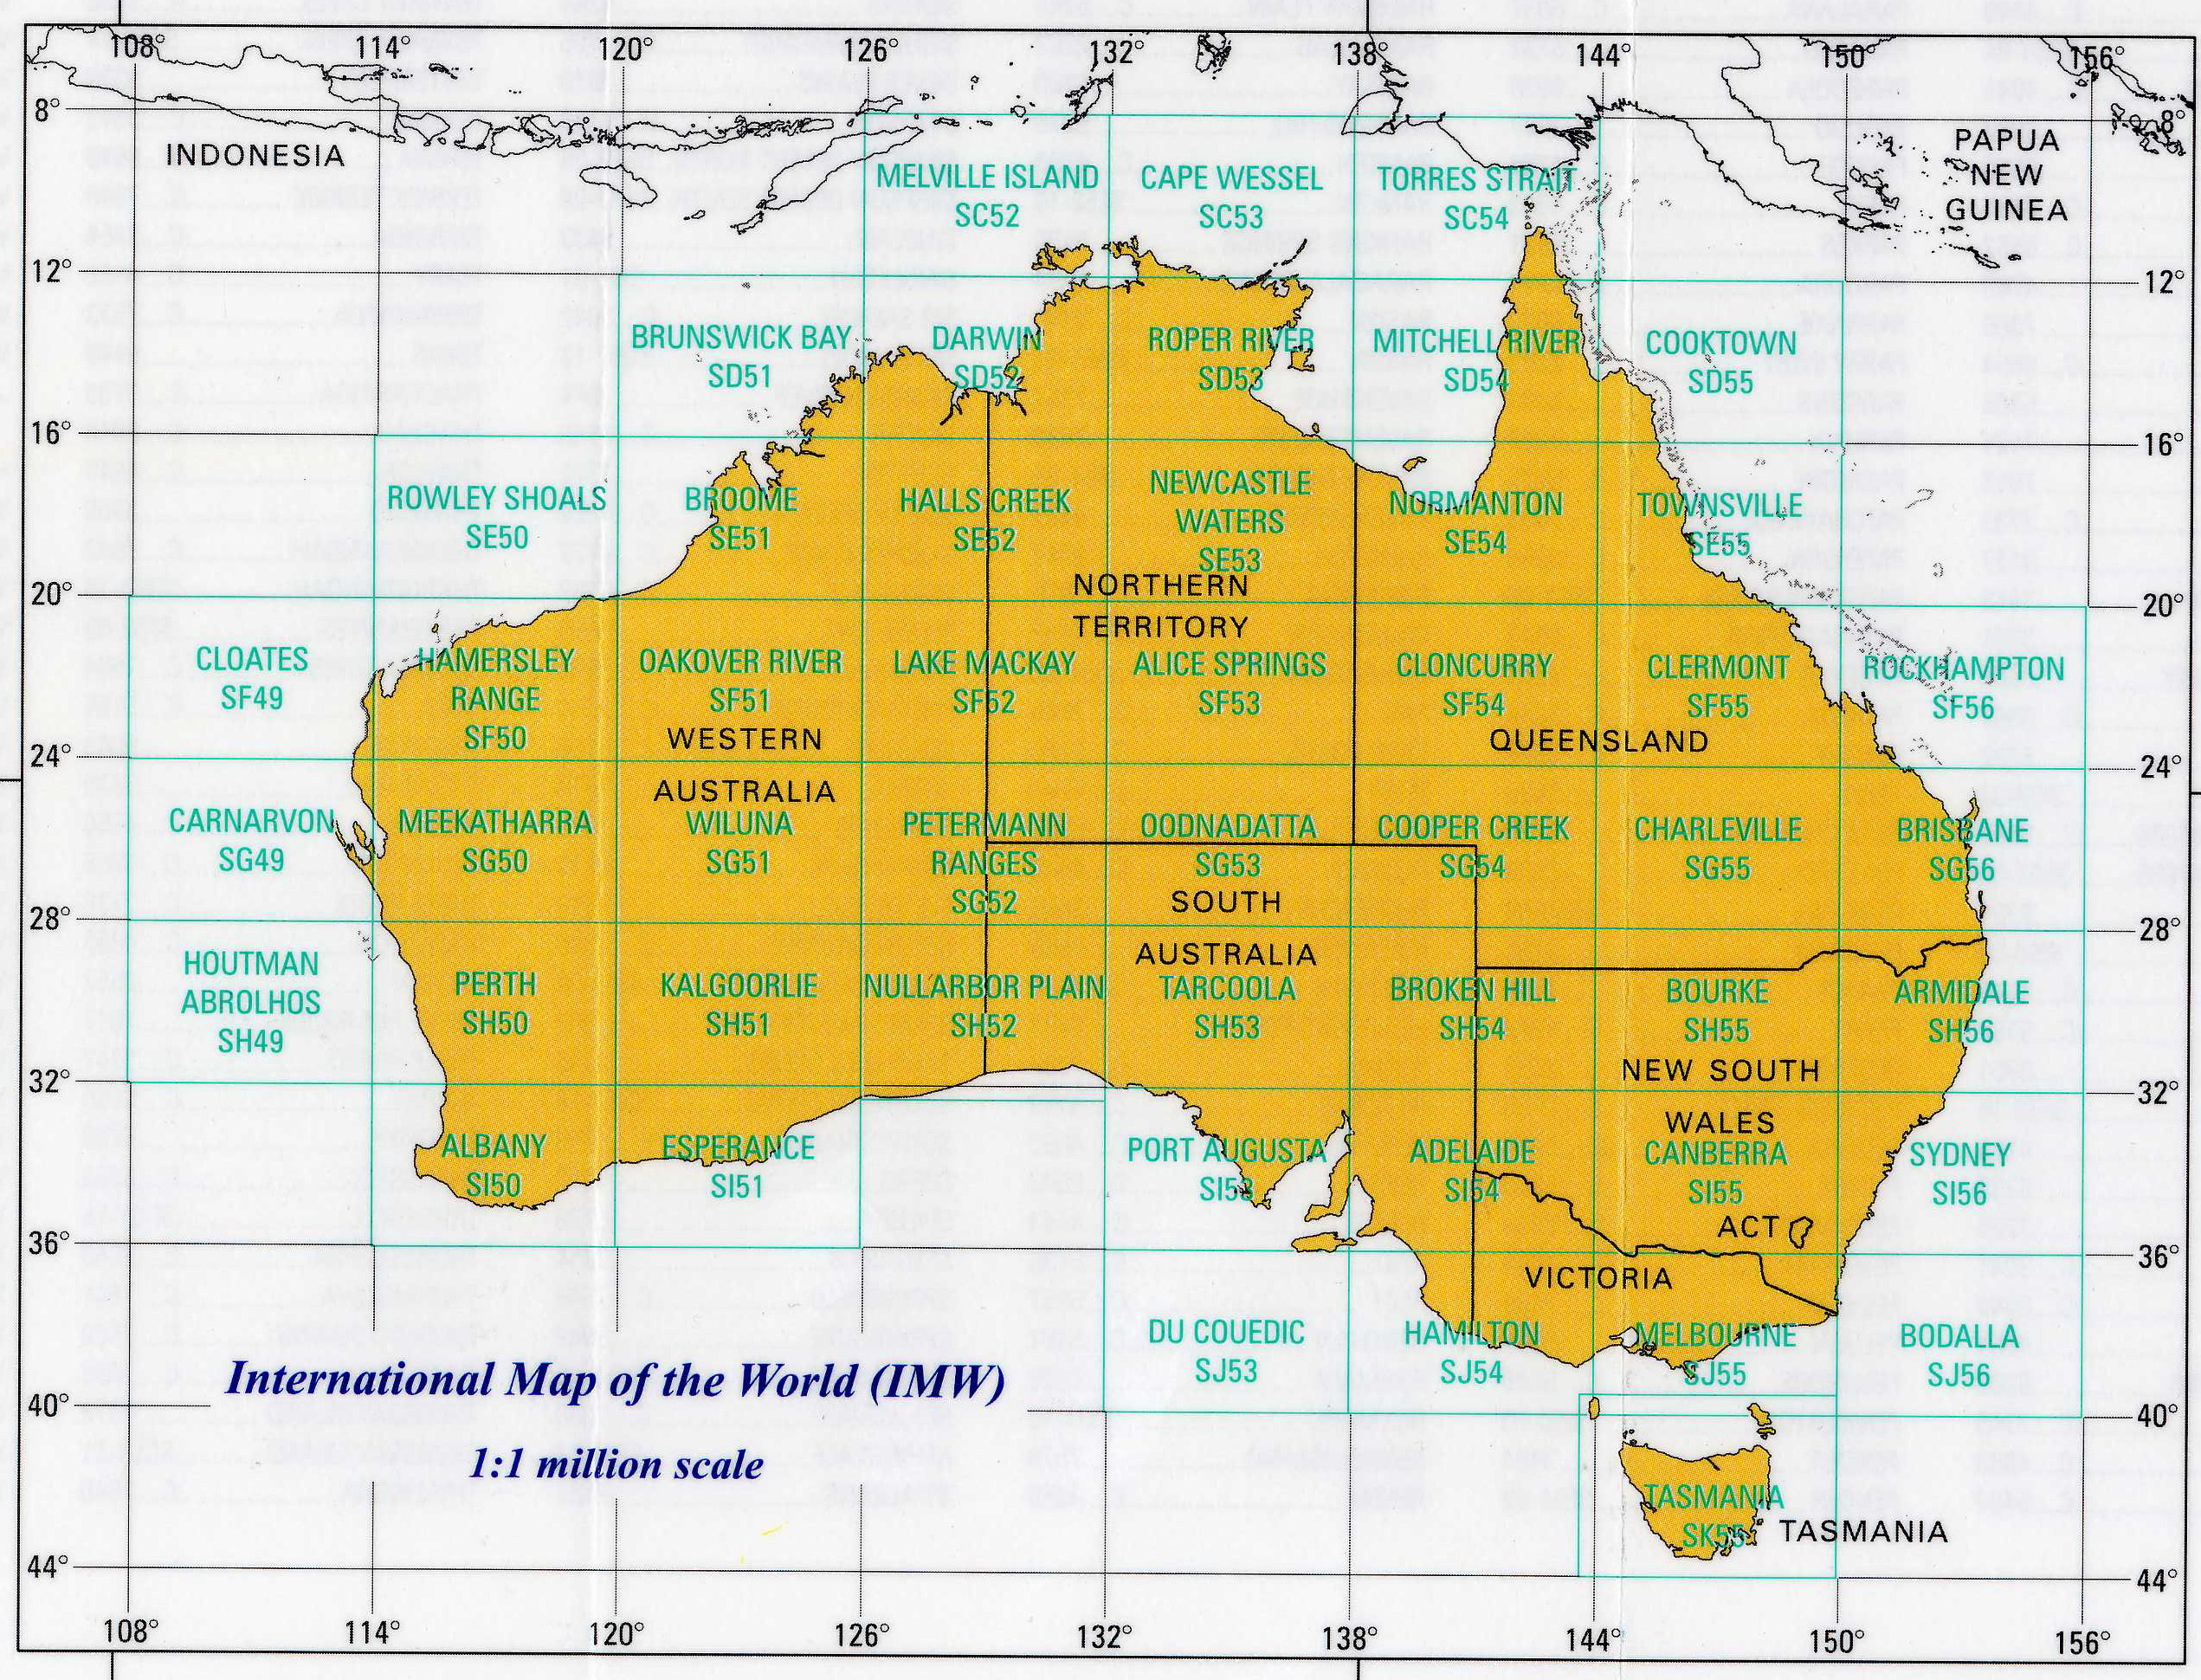
Note the index shows that the map sheets in this series have been produced using a regular grid of latitude and longitude. Each map has been given a unique number and name.
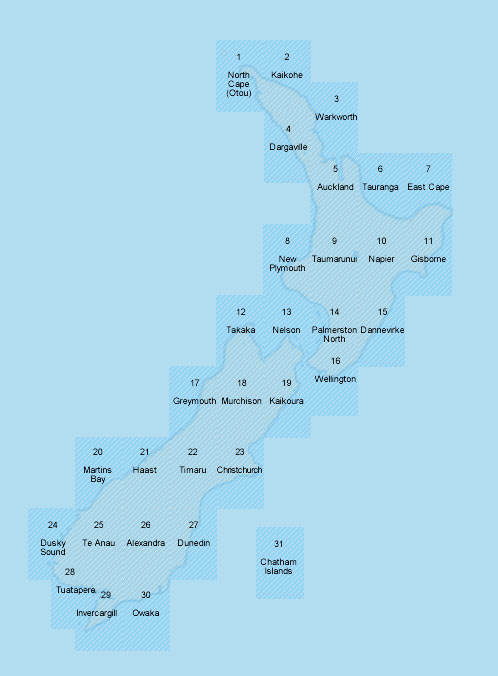
In the case of New Zealand, because of the north–east ⁄ south–west alignment of the country, the producing agency (Land Information New Zealand) has opted to not use a regular grid, but rather has chosen to position the map sheet edges to minimise the amount of ocean on each sheet. They have called this series of map the New Zealand 262 series and each map has a unique number 1 to 18.
Specialist Series Maps
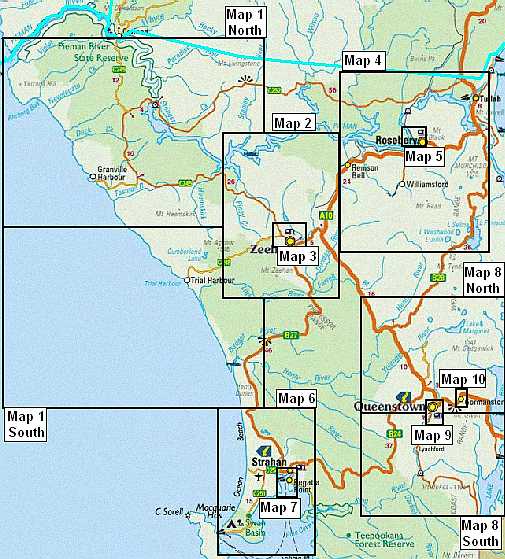
These typically have different scales depending on the area and detail being mapped. They do not necessarily join together to form a continuous coverage but use a consistent design concept so that the maps ‘look’ similar. A good example is street maps of cities and towns and marine navigation charts.
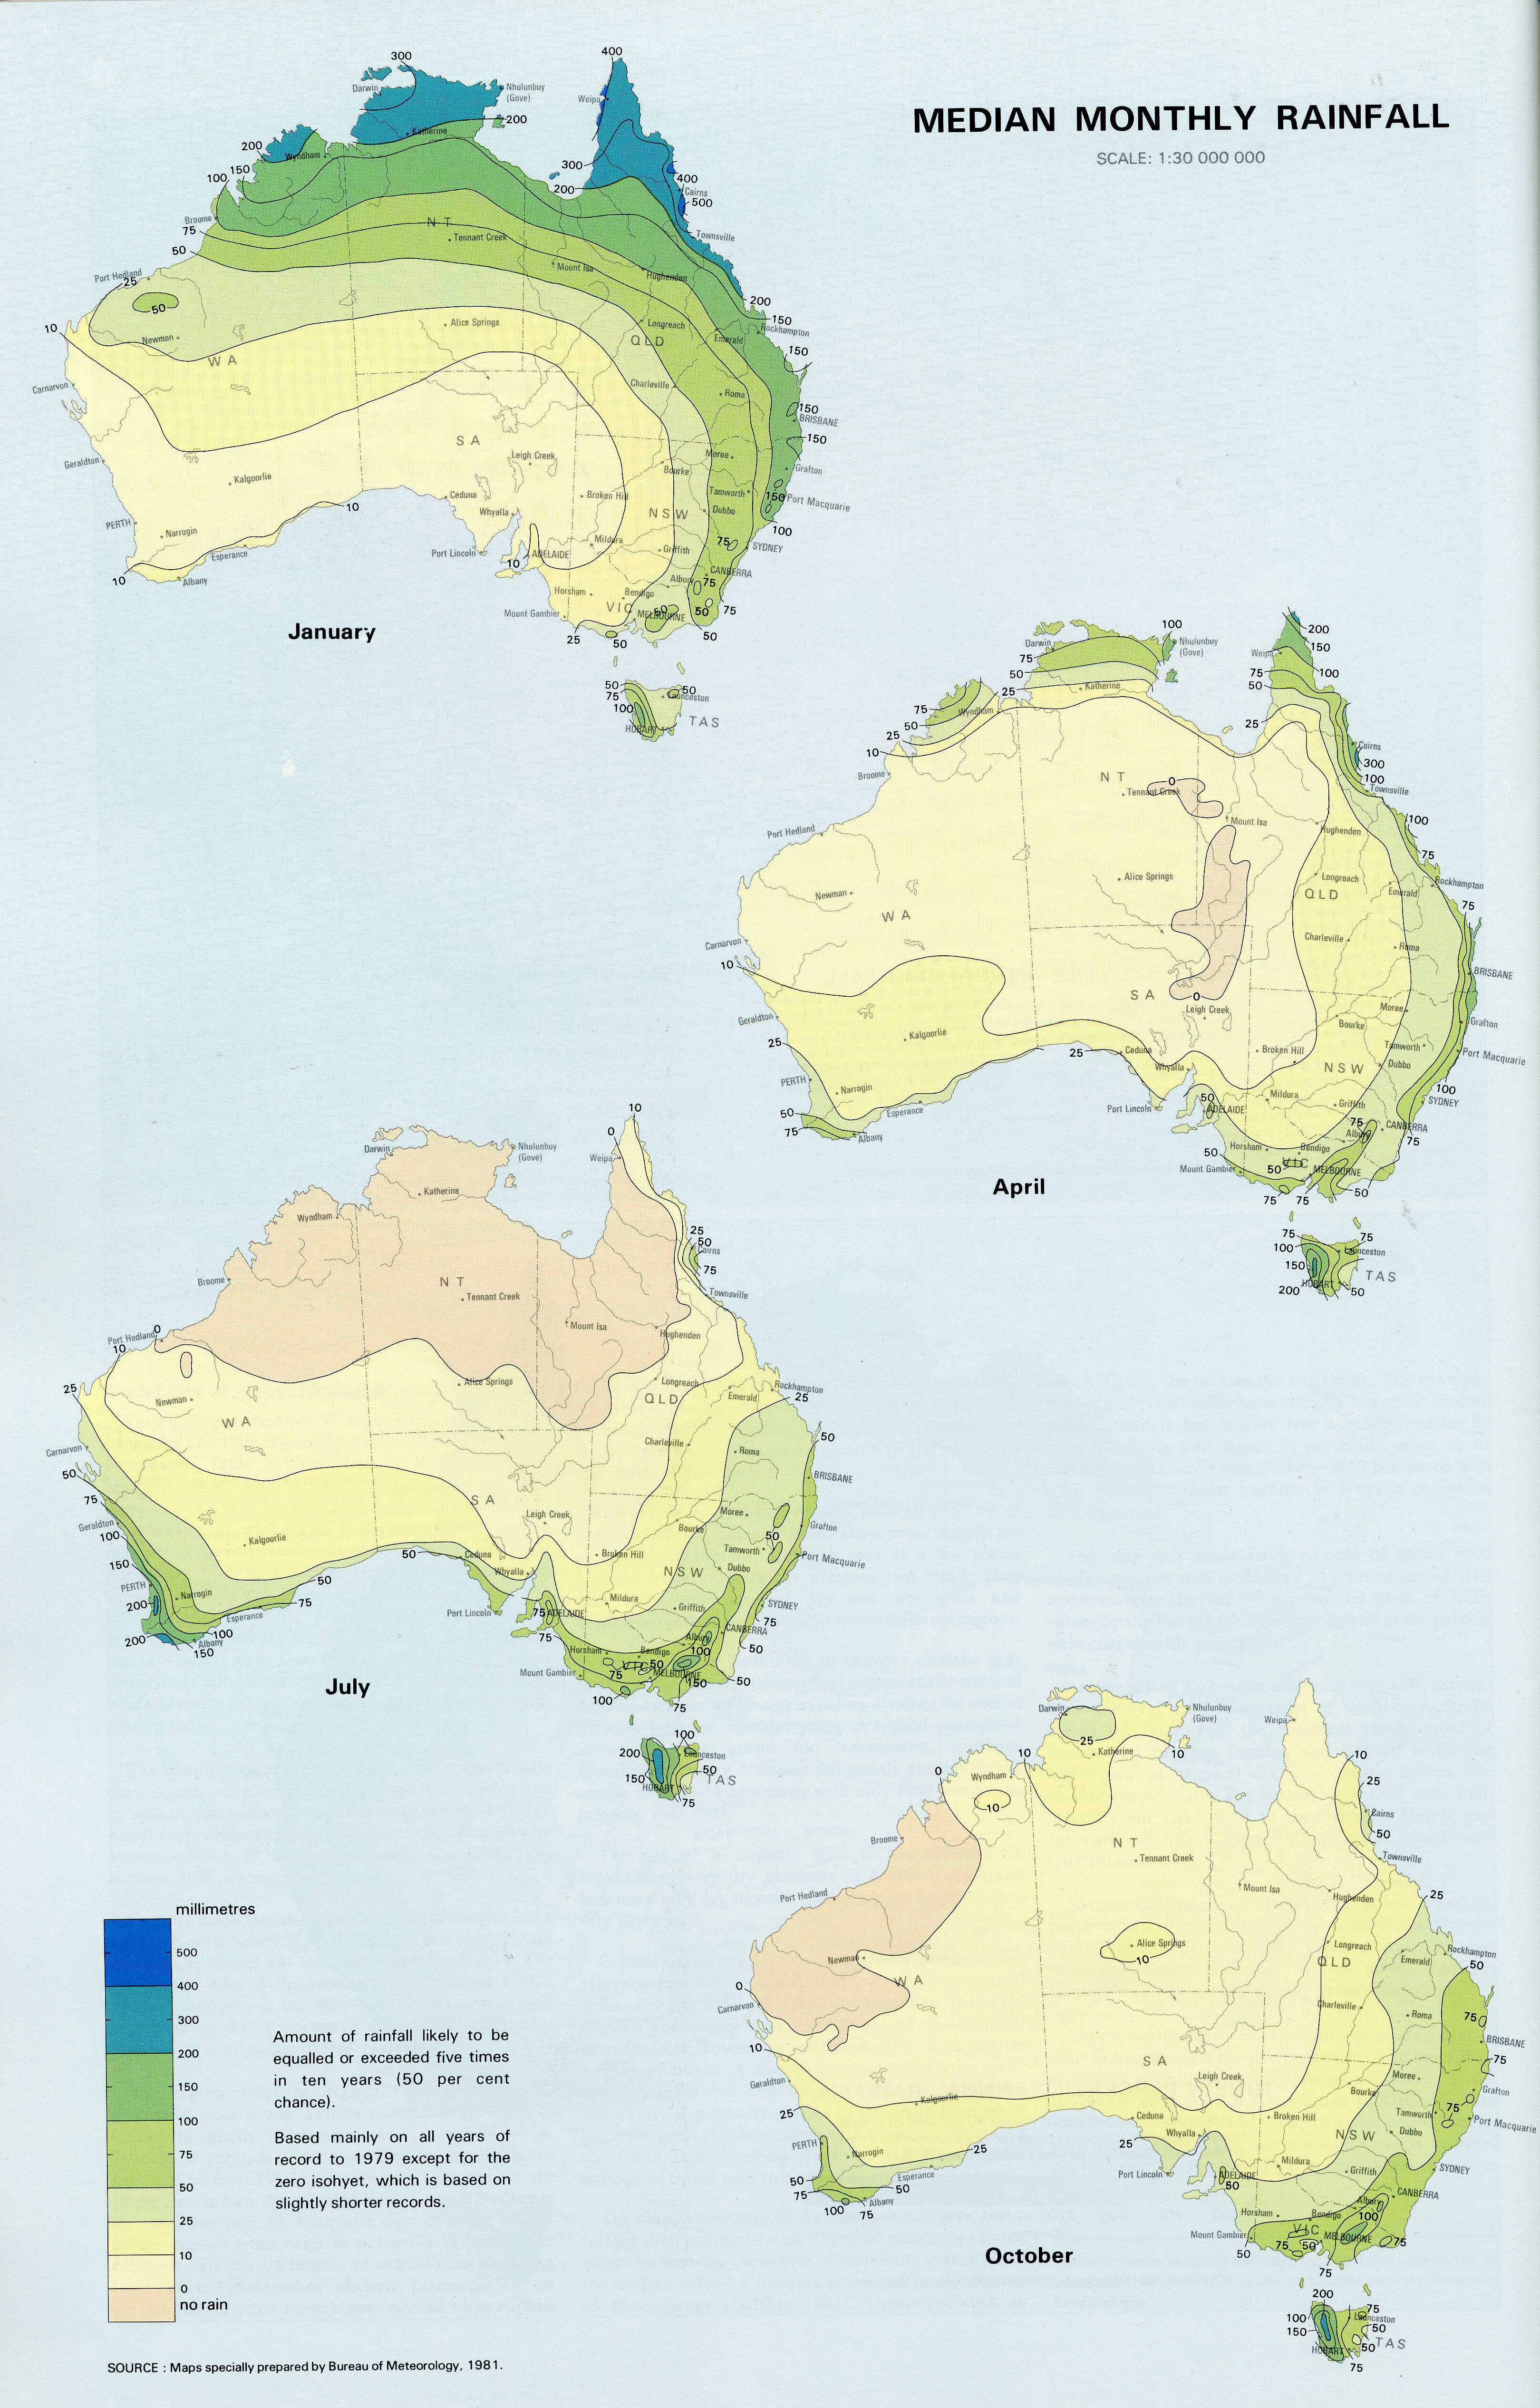
Time Series Maps
These are commonly thematic maps showing change in a selected area over time. The most frequently encountered time series maps are the daily weather charts produced by the Australian Bureau of Meteorology.